
Help & User Guide
ReSite Finder allows you to analyze DNA sequences and visualize restriction enzyme cut sites. Follow the guide below to learn how to use the tool effectively.
Step 1: Enter Sequence Input
You can input DNA in raw text, FASTA, GenBank ID formats.
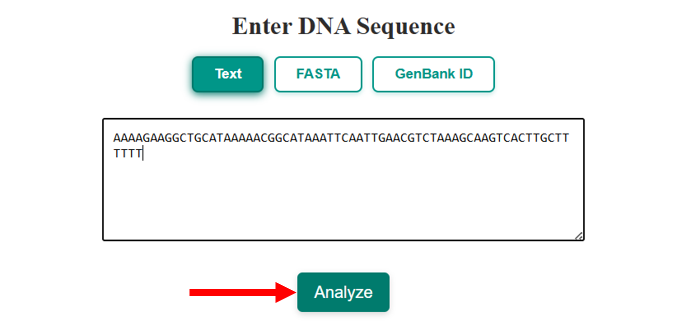
Fig 1: User enters a sequence in text format and clicks “Analyze”.
Step 2: Review Sequence Statistics
Once analysis begins, the first section of results displays useful sequence statistics:
- Base counts (A, T, G, C)
- AT/GC content
- Molecular weight
- Melting temperature
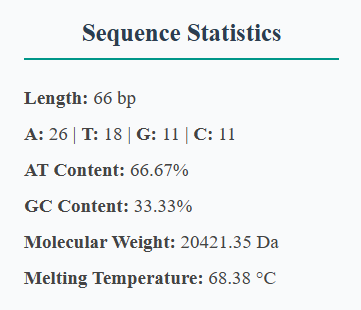
Fig 2: Sequence statistics output with key metrics.
Step 3: View Cut Site Visual Map
This interactive map shows where each restriction enzyme cuts the top and bottom strands. Hover for tooltips and scroll to zoom or pan.
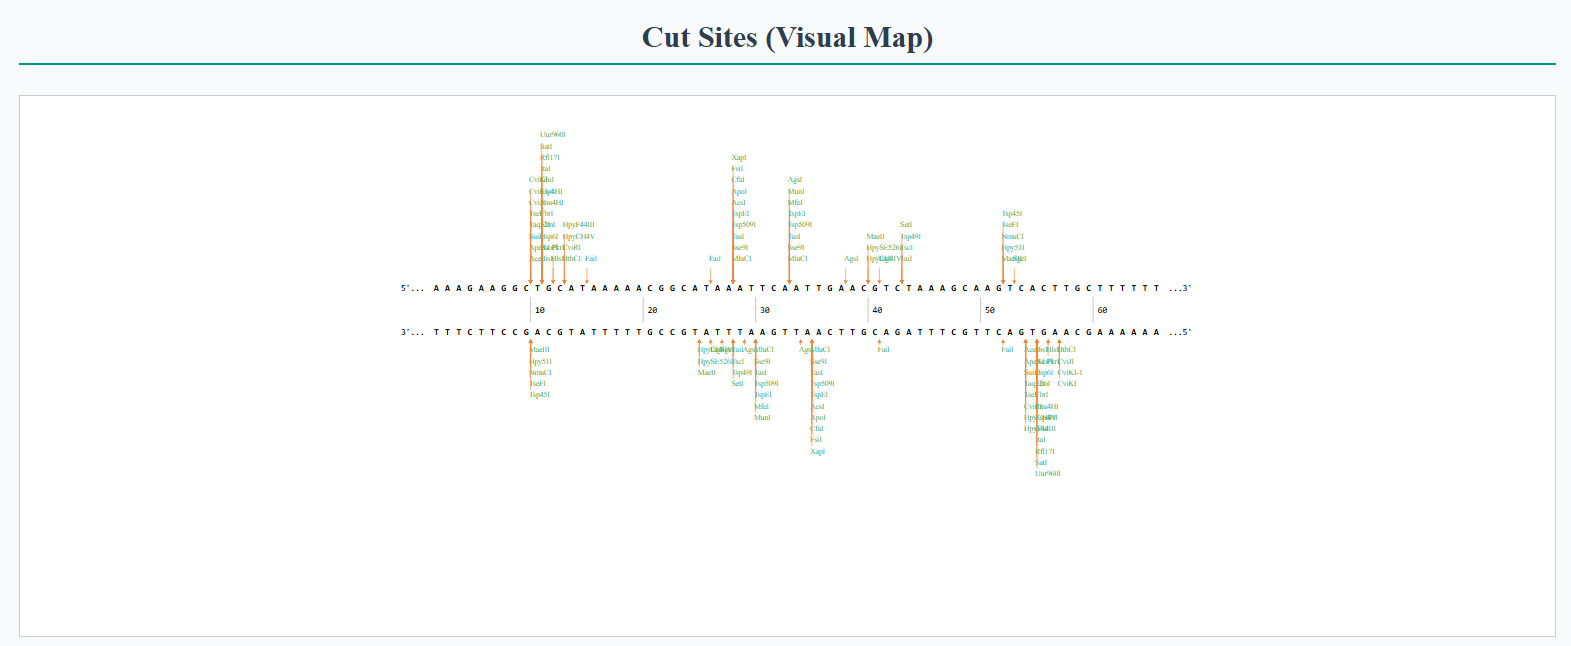
Fig 3: Visual map showing enzyme cut positions on the sequence.
Step 4: Interpret Cut Site Table
The table provides an overview of:
- Enzyme name
- Recognition sequence
- Cut site length
- Frequency of cuts
- Top and bottom strand cut positions
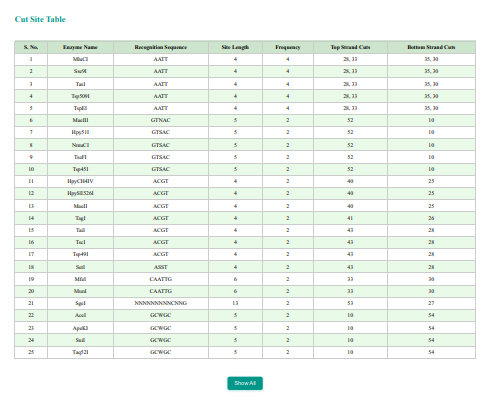
Fig 4: Tabular view of all identified cut sites.
Troubleshooting
- Ensure correct formatting for FASTA or ID-based inputs
- Use smaller sequence portions for better visual clarity
Still Need Help?
Visit the Contact Us page or email us. Feel free to ask.